In a single glance, your new Plan Health Dashboard brings meaningful data and actionable items together onto one screen. Starting with a Plan Summary, easy infographics show you where your plan is today. Together, we can dig a little deeper and identify ways to help your participants improve their retirement readiness.
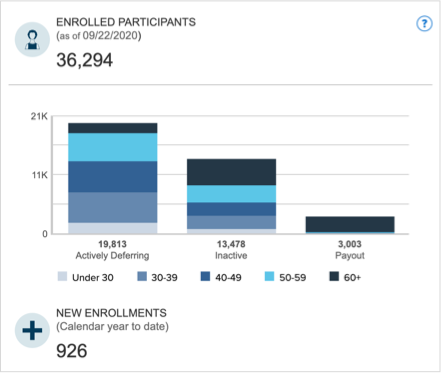
How many are participating?
- Status, age
- New enrollments
Dig deeper
- Participant demographics
- Gender (male/female)
- Online enrollment
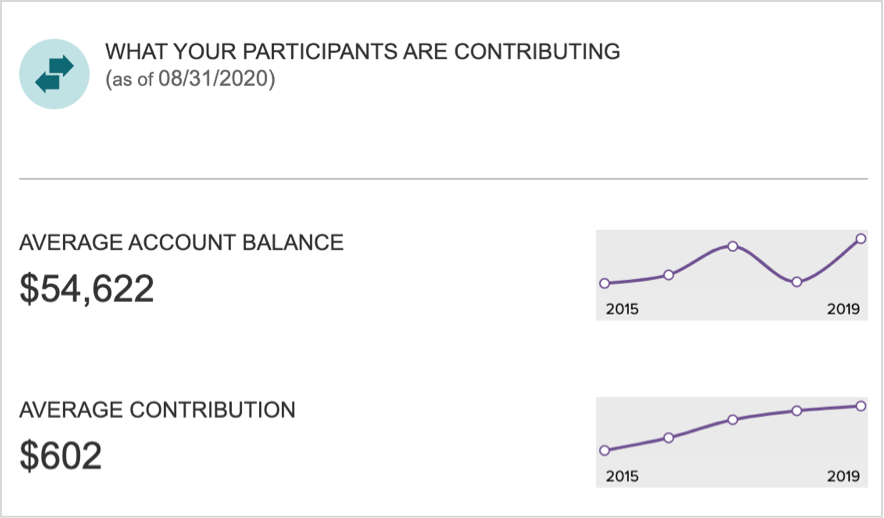
How are they saving and investing?
- Average account balance
- Average contribution
Dig deeper
- Historical trends
- Percent of participants with YTD increased contributions
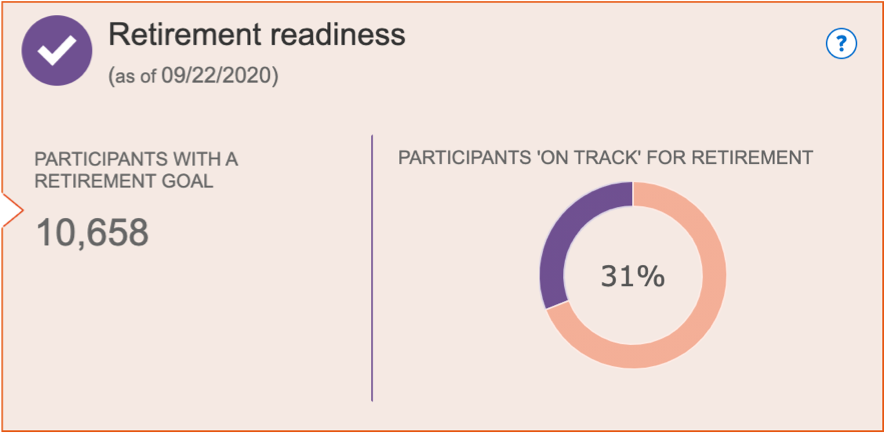
How many are ready for retirement?
- Number of participants with online account
- Number of participants with a retirement goal
- Number of participants ready for retirement
- Plan-level peer comparison
Dig deeper
- Identify opportunities to engage employees and participants